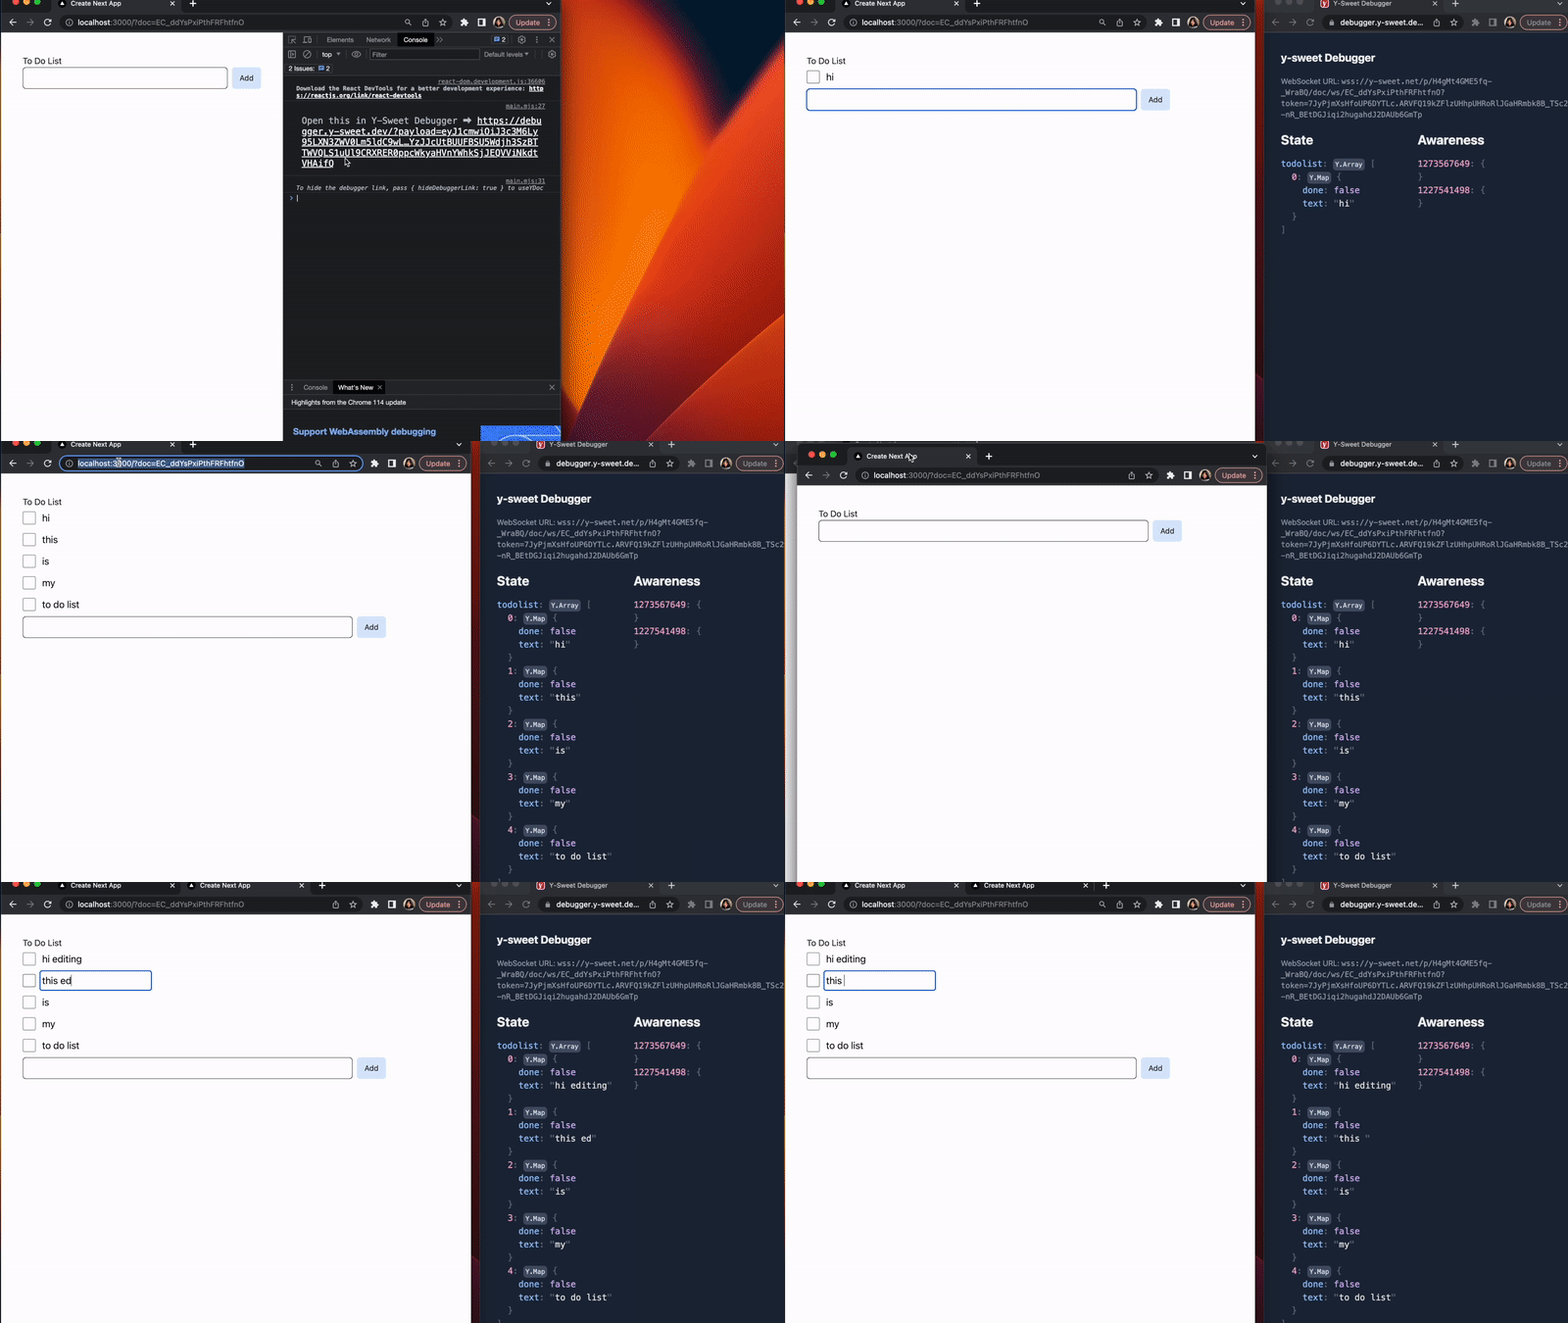
The Y-Sweet Debugger
The debugger is part of our mission to improve the overall user experience when using Yjs to build your app's data structures. Logging Yjs data types directly in the console can be notoriously hard to read. With the debugger, your Yjs data looks just like normal Javascript objects, arrays and strings.
To use the debugger, open your browser's Developer Tools (Chrome, Safari, Firefox) and look for large text that says “Open this in Y-Sweet Debugger”, then click the link.
